Sub Account Analytics Overview
This guide provides an overview of the Sub-Account dashboard in your Voicemetrics account, including key metrics and widgets.
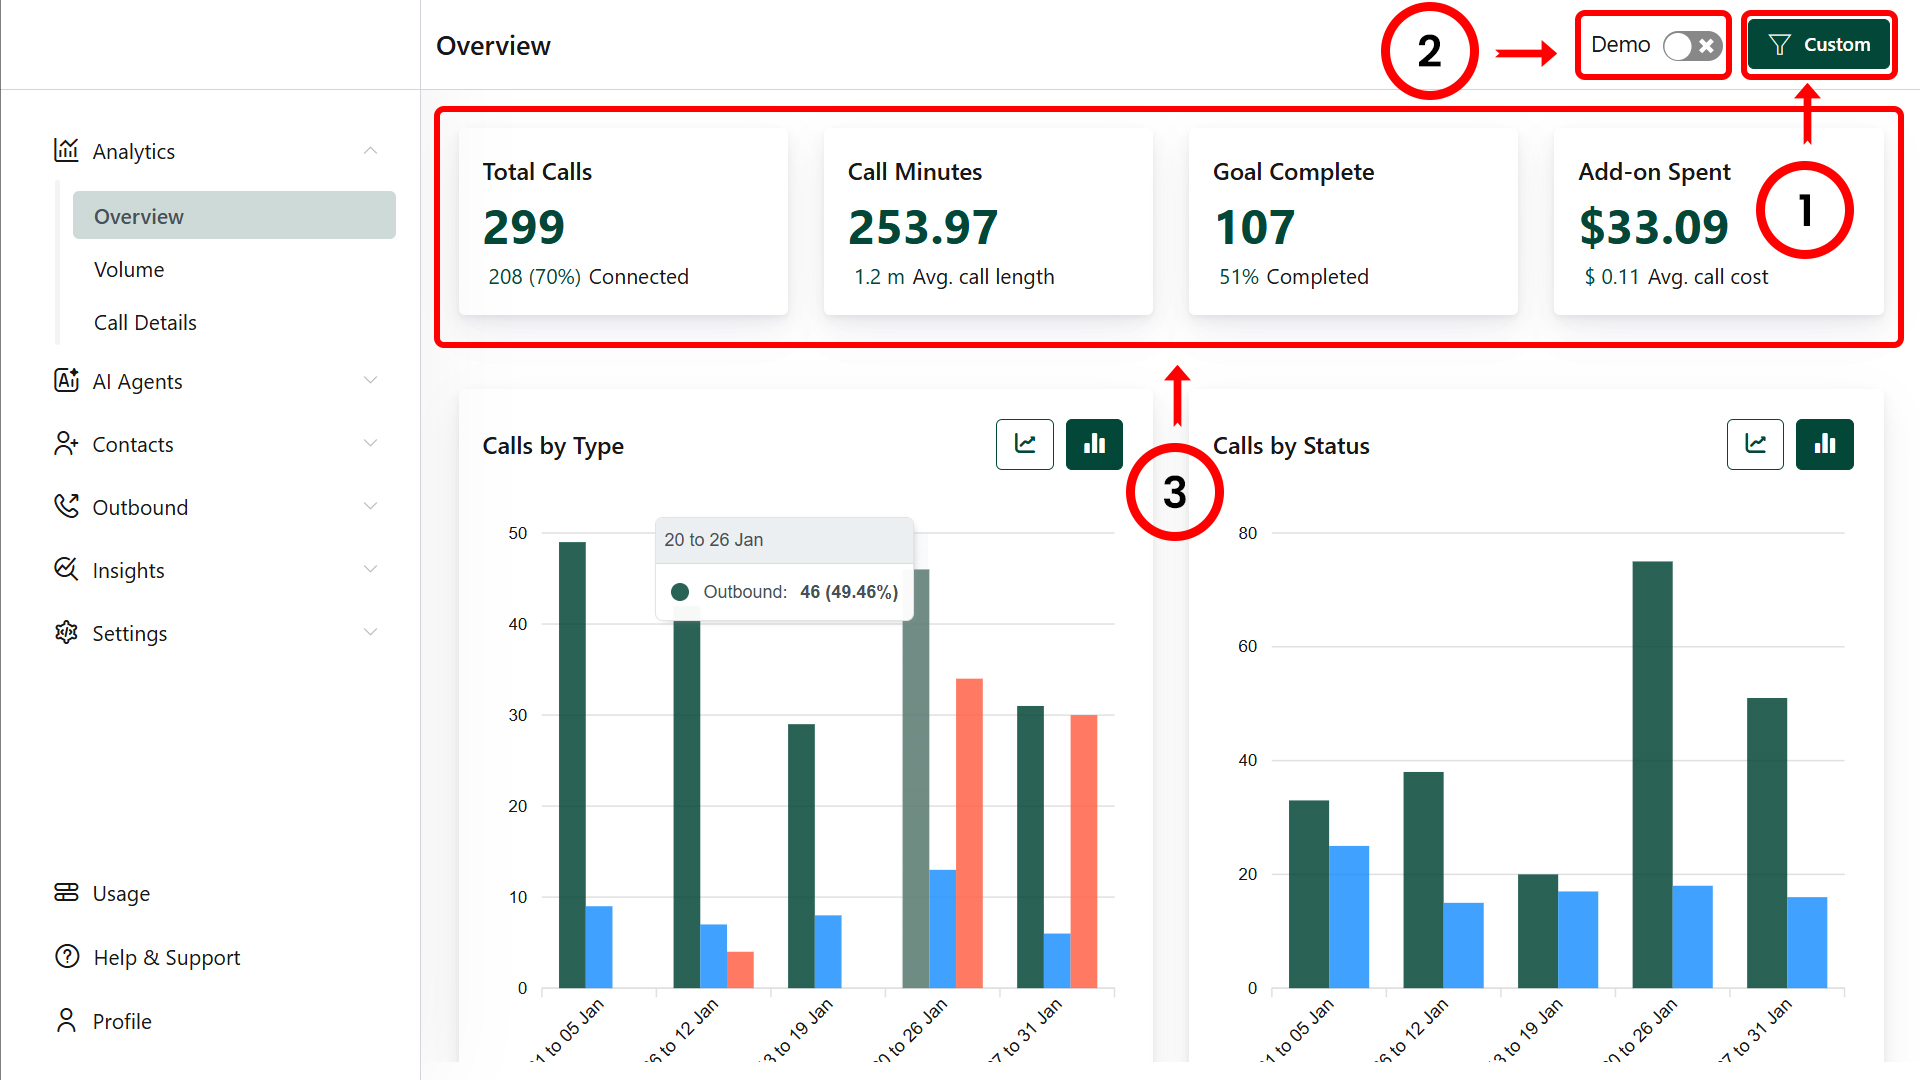
1. Date Filter
- By default, the dashboard displays data from the last 30 days.
- Use the filter to select other date ranges (e.g., Today, Yesterday, etc.) to generate the required overview.
2. Demo Data
- Enable this option to view sample data for reference.
3. Calls Summary
Metrics:
- Total Calls: Total number of calls dialed or received within the selected date range.
- Connected Calls: Total number of successfully connected calls within the selected date range.
Performance:
- Call Minutes: Total call duration (in minutes) for the selected date range.
- Avg. Call Length: Average duration of calls during the selected date range.
Goals:
- Goal Achieved: Number of goals successfully completed.
- Completed (%): Percentage of goals completed.
Costs:
- Add-on Spent: Additional charges incurred for extra minutes, if applicable.
- Avg. Call Cost: Average cost per minute.
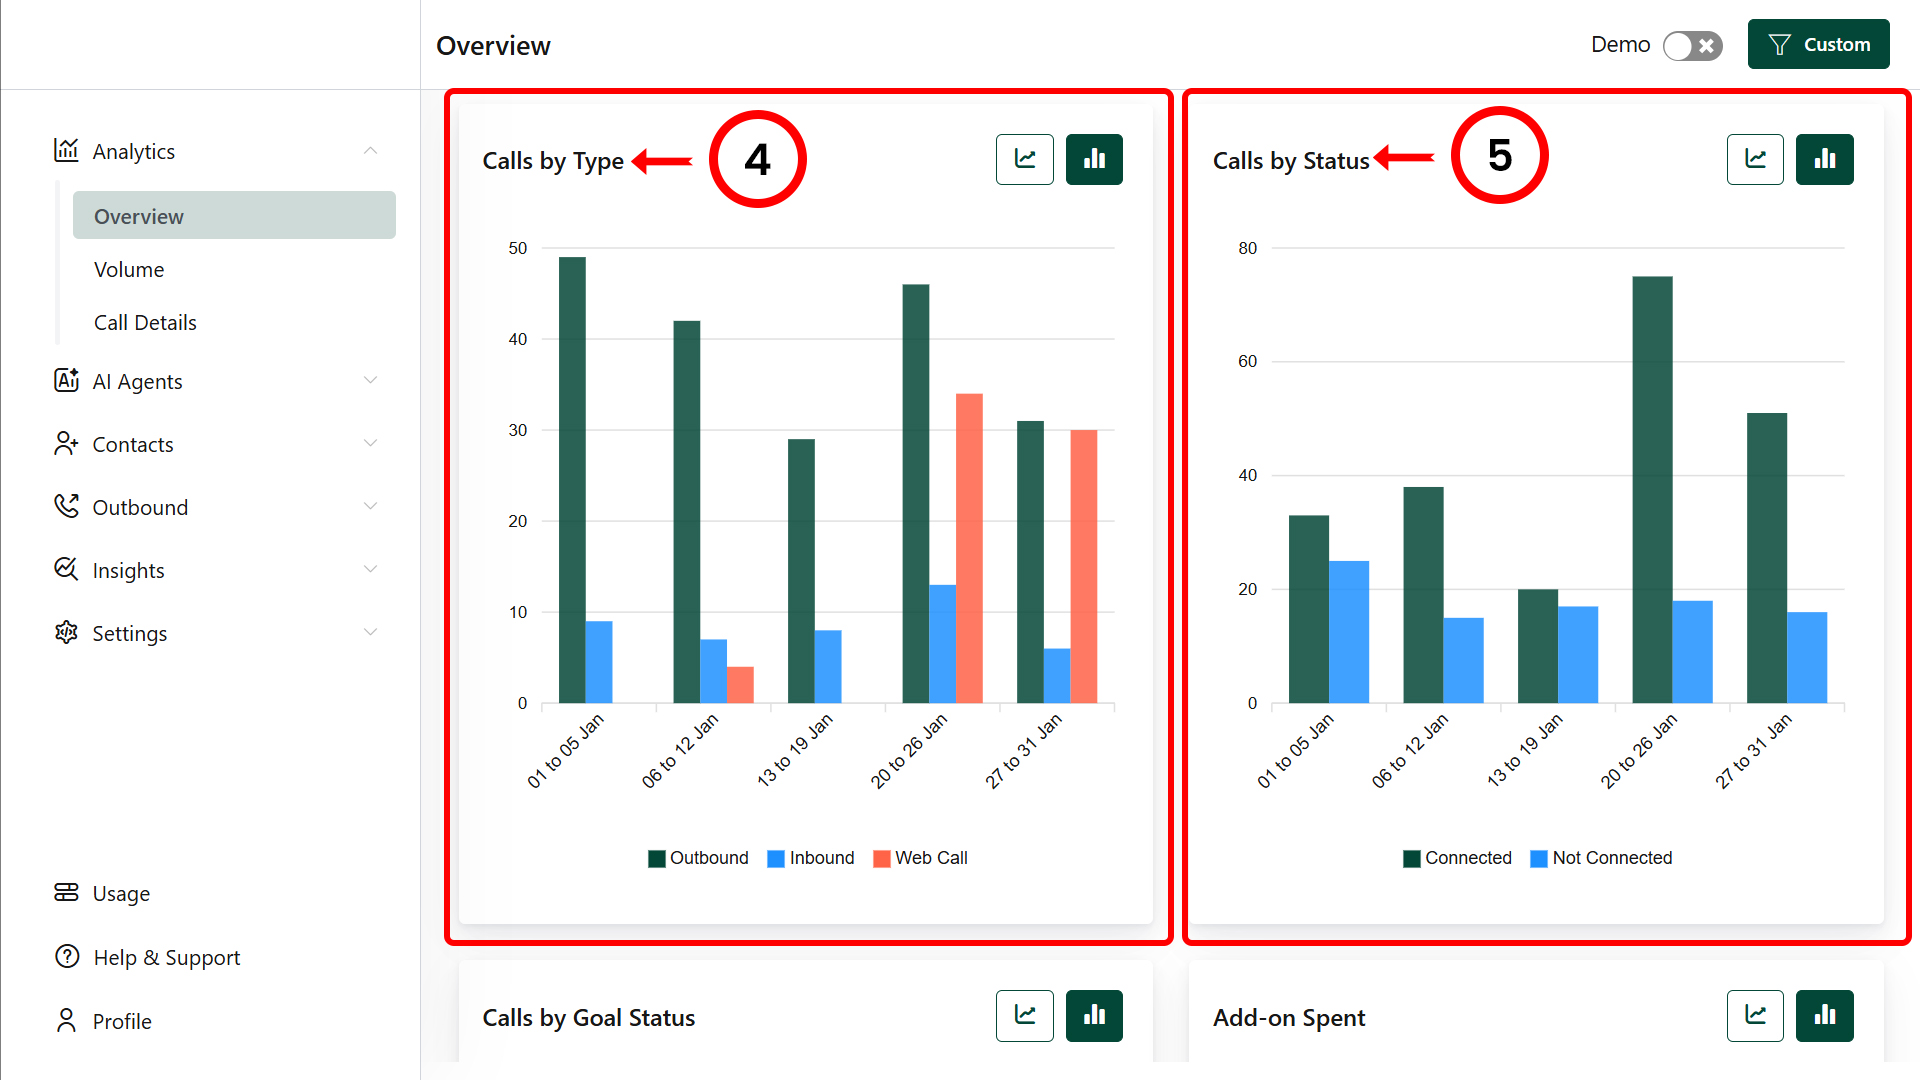
4. Graph Widget: Calls by Type
- Displays a breakdown of calls by type: Outbound, Inbound, and Web.
5. Graph Widget: Calls by Status
- Shows the status of calls: Connected and Not Connected.
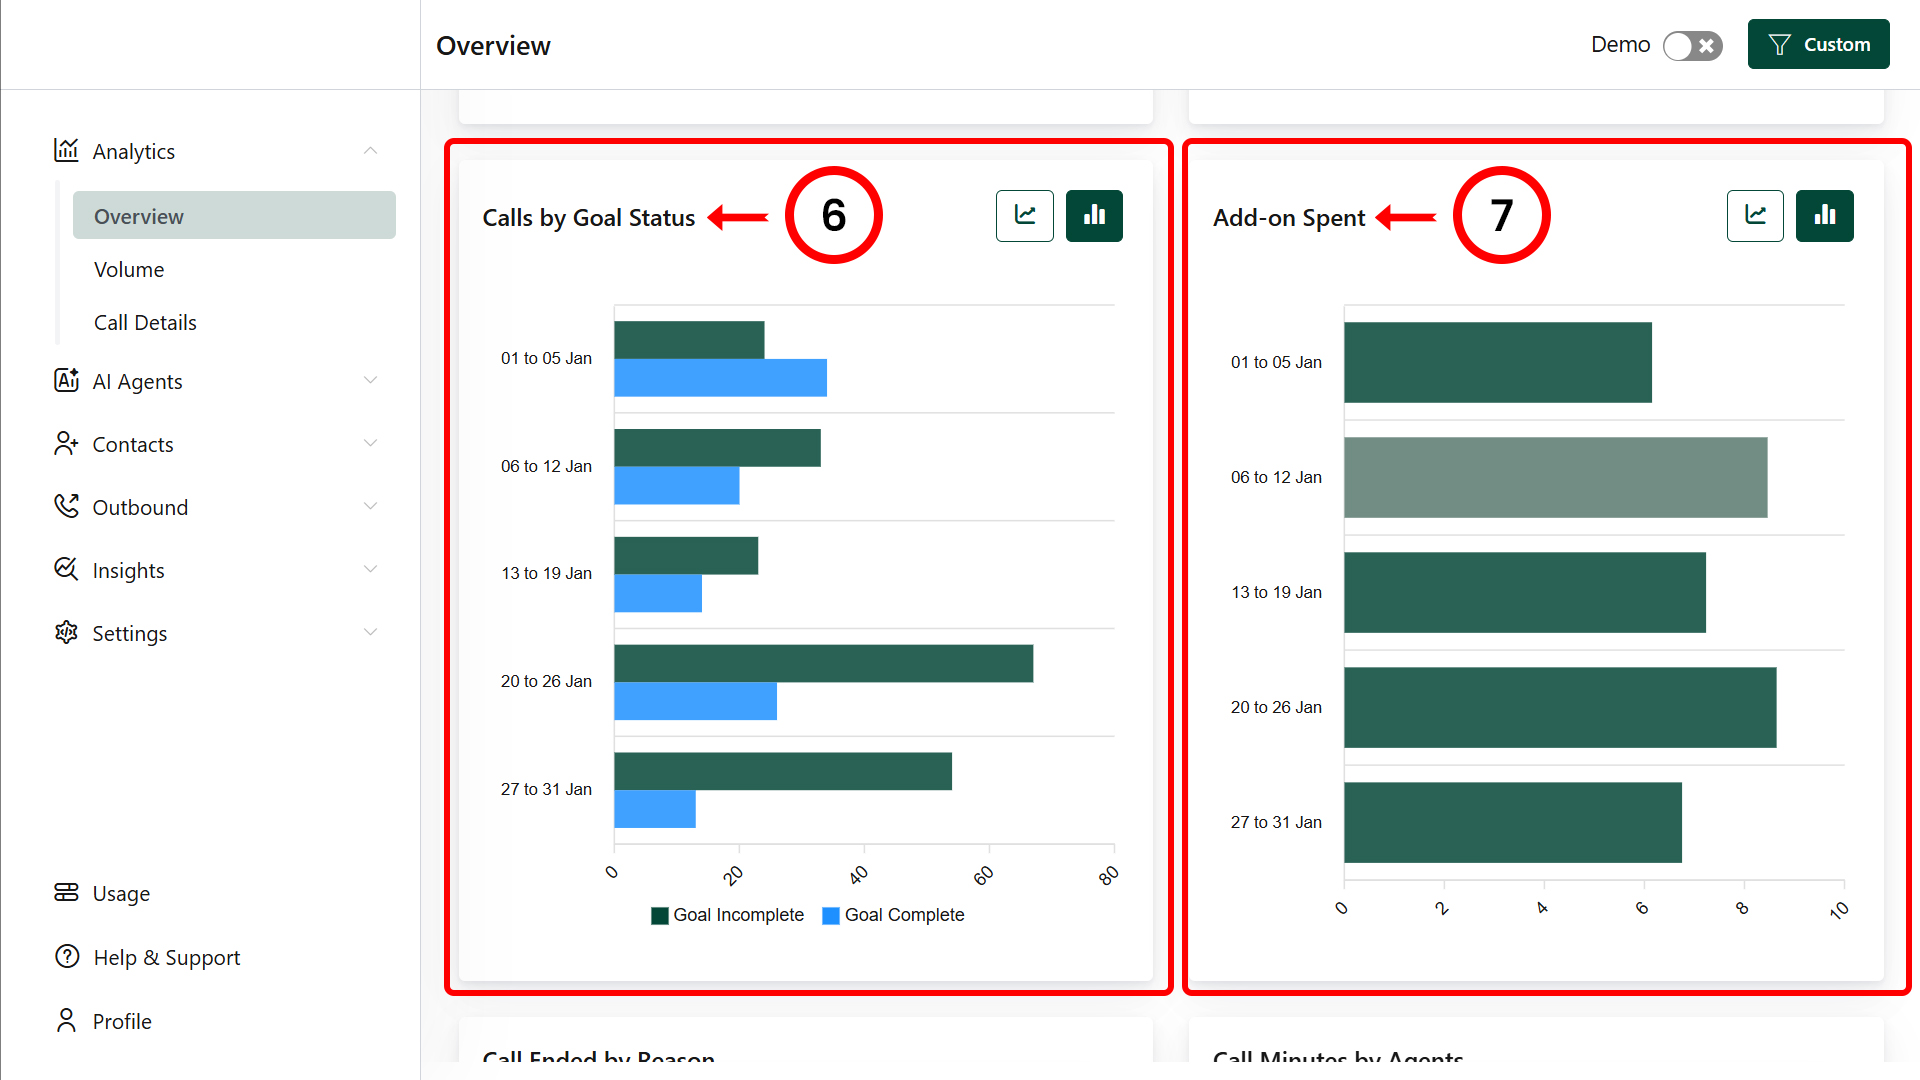
6. Graph Widget: Calls by Goal Status
- Visualizes goal status: Complete and Incomplete.
7. Graph Widget: Add-on Spent
- Represents the add-on minutes used during the selected date range.
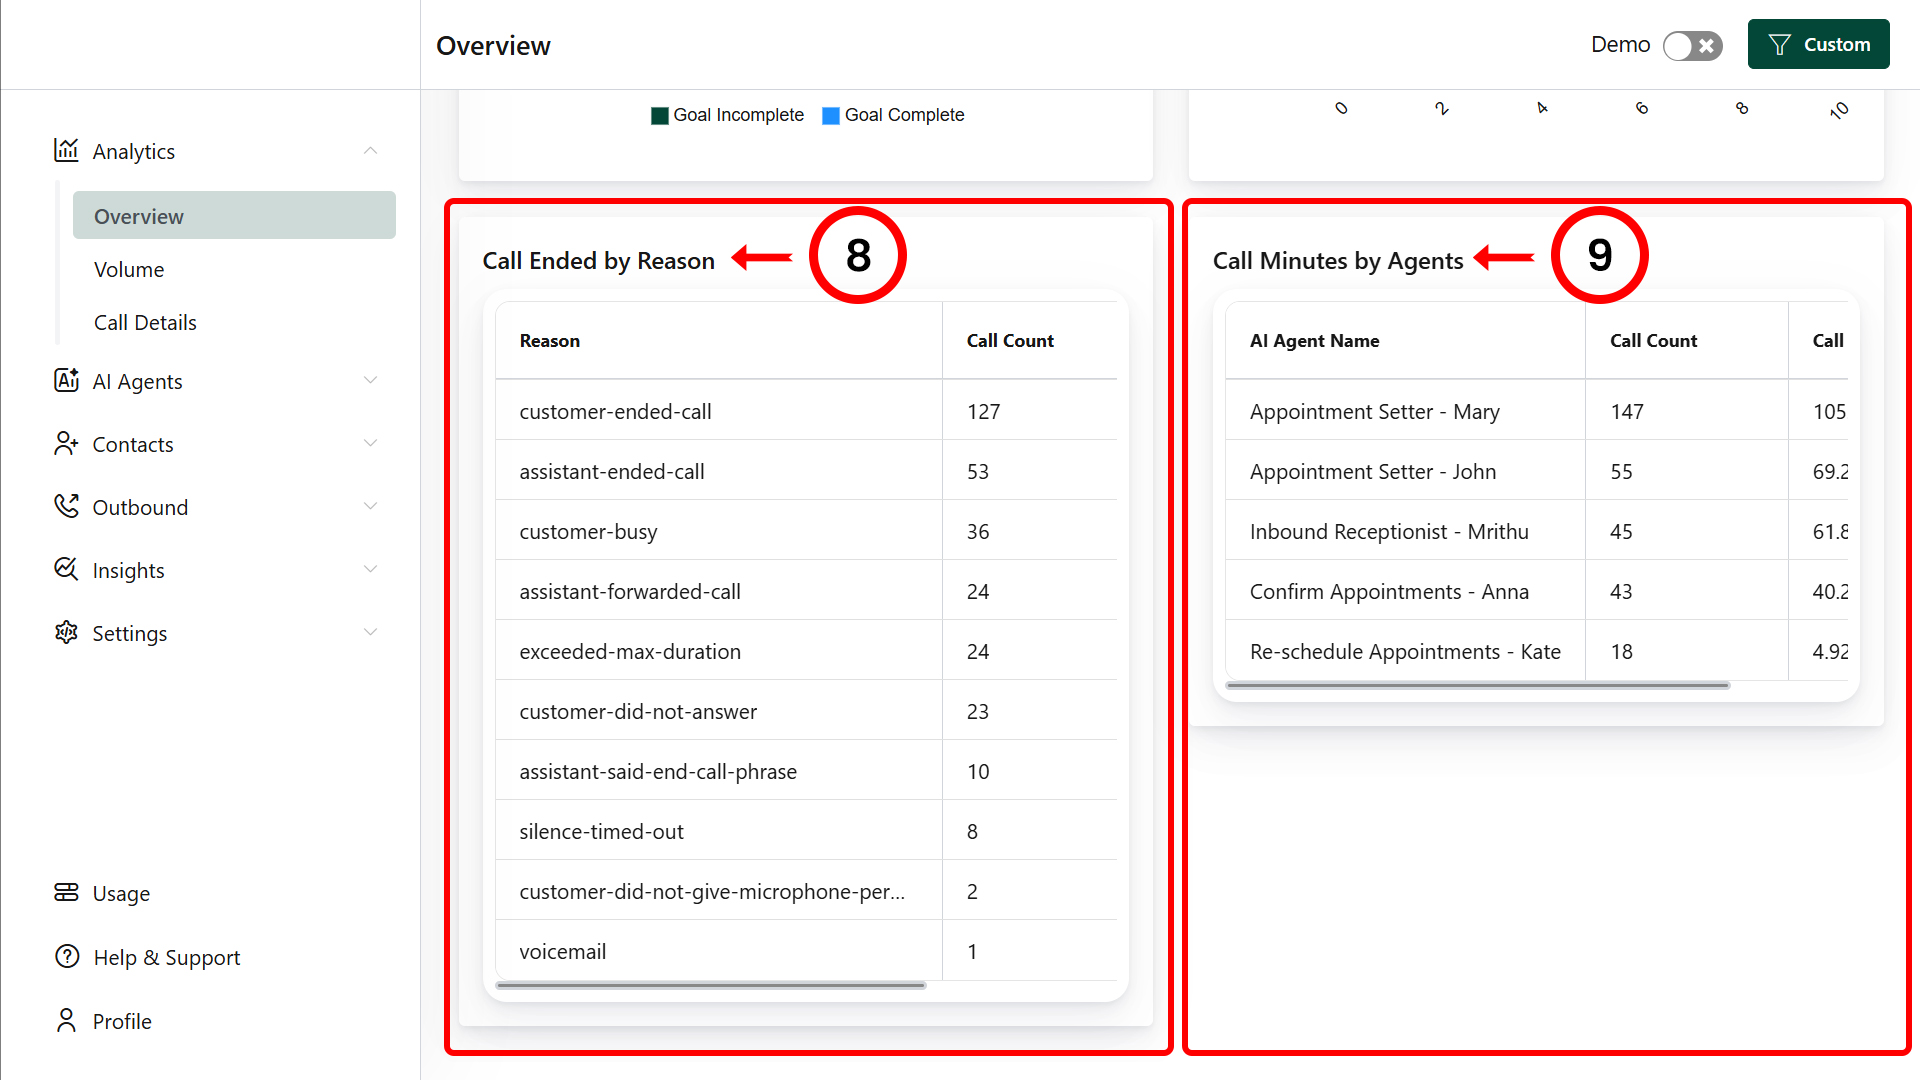
8. Graph Widget: Call Ended by Reason
- Displays the reasons why calls were ended (e.g., user disconnected, dropped, etc.).
9. Graph Widget: Call Minutes by Agents
- Shows the performance of AI agents by call duration for the selected date range.
Need Help?
For troubleshooting, refer to the Knowledge Base or contact our Support Team ([email protected]).
Thank you for choosing our Voicemetrics!